
I have been reading Miller & Ranum's e-book on Python/Algorithms. (A superb book which is also free online.) While looking through their chapter on Algorithm Analysis, I took their idea of using the Python Timer and timeit methods a bit forward to create a simple plotting scheme using matplotlib.
Here is the code. You can add in your own function here and plot the time complexity.
The code is quite simple. Perhaps the only interesting thing here is the use of partial to pass in the function and the N parameter into Timer.
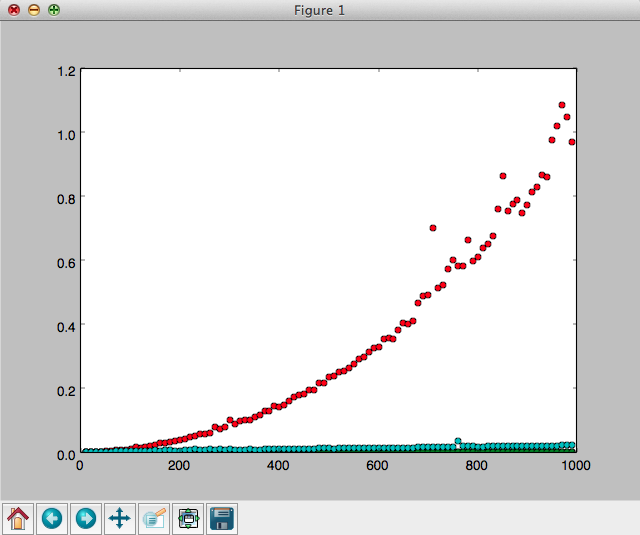
Here is the output.
Have fun! ;-)